How to Use the Heikin-Ashi Chart in Forex Trading
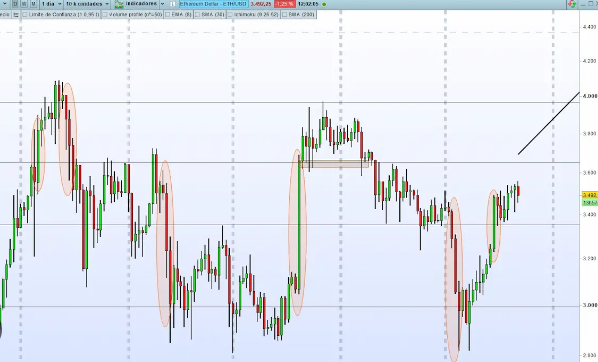
The Heikin-Ashi chart is a popular technical analysis tool used in forex trading to identify trends and potential trading opportunities. It differs from traditional candlestick charts as it aims to filter out market noise and provide a smoother visual representation of price action. Here are steps to use the Heikin-Ashi chart in forex trading:
- Set up the Heikin-Ashi chart: Most trading platforms offer the option to switch to Heikin-Ashi charting. Locate this option and apply it to the desired currency pair or financial instrument.
- Understand the Heikin-Ashi candlestick: Each Heikin-Ashi candlestick represents a specific time period, such as a day or an hour. The body color of the candlestick indicates the direction of the trend – green (bullish) or red (bearish). The length and shape of the candlestick reflect the price movement during that period.
- Identify trends: Heikin-Ashi charts are particularly helpful in identifying trending markets. Look for a series of consecutive bullish (green) or bearish (red) candlesticks. A strong uptrend is indicated by a series of green candlesticks, while a strong downtrend is indicated by a series of red candlesticks.
- Spot reversals: Watch for potential trend reversals on the Heikin-Ashi chart. Reversals are indicated when the trend changes from a series of consecutive green (bullish) candlesticks to red (bearish) or vice versa. These reversals can suggest potential entry or exit points for trades.
- Analyze patterns and candlestick formations: Apply traditional technical analysis techniques to Heikin-Ashi charts, such as support and resistance levels, trendlines, and chart patterns. Look for familiar candlestick formations like doji, shooting star, hammer, or engulfing patterns. These patterns can provide additional insights into market sentiment and potential trading opportunities.
- Combine with other indicators: Enhance your analysis by combining Heikin-Ashi charts with other technical indicators such as moving averages, oscillators, or volume indicators. This can help validate signals and provide additional confirmation before entering or exiting trades.
- Practice and backtest: As with any trading approach, it’s crucial to practice using the Heikin-Ashi chart and conduct thorough backtesting on historical data. This will help you understand its effectiveness, strengths, and limitations. Develop a trading strategy that aligns with your trading style, risk tolerance, and goals.
Remember that no single tool or chart can guarantee trading success. The Heikin-Ashi chart is just one tool in a trader’s arsenal and should be used in conjunction with other analysis techniques and risk management strategies. Continuous learning, experience, and adaptability are essential for successful forex trading.


Post Comment